Technology Stack
* The below logos are copyrighted and owned by their respective owners / organizations.
* The logos are copyrighted and owned by their respective owners / organizations.


Features

Need larger plans or looking to purchase a Mieruka?
Using MIERUKA you feel secure:
Logins are secured and integrated with AD (Active Directory). Any data transmission between server and client is secured using tokenization. Once user request for login the token will assign to the user. If the time limit exceeds, the token will expire. Unknown authorization will not be allowed.

Role based authentication:
The Settings option is only visible to admin users. There are two types of admin available in the application: Super admin and Group admin
Settings option available for Super admin are:
User
Management
Table configuration
master
Dynamic Report
Configuration master
L2 Equipment Sync configuration master
Role code
master
Image
master
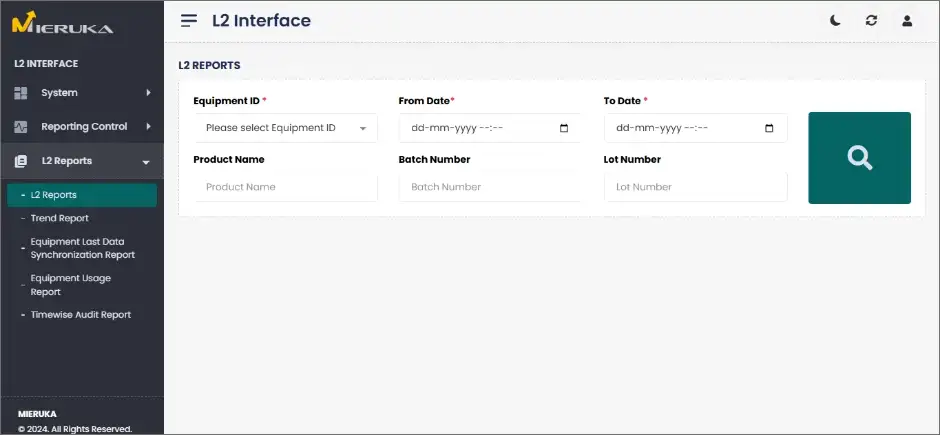
MIERUKA - Centralises all equipment data and reports in one place.
Why KPIs Matters?
Status type page is used to configure KPIs for your daily business needs.
Identifying and tracking KPIs lets you know if your business is on the right path or if you should avoid losing valuable time and money. When used properly, KPIs are powerful that help you:
- Measure results against strategic goals.
- Spot problems early on.
- Make timely adjustments to tactics.
- Make better decisions, faster.
Features of MIERUKA
- Comprehensive Audit Log Management
- Seamless Role Code Integration
- Streamlined User Management
- Real-time insights
- Business Metrics and Goals
- Reliable Equipment Communication
- Alert Messages
- Effortless Database Synchronization
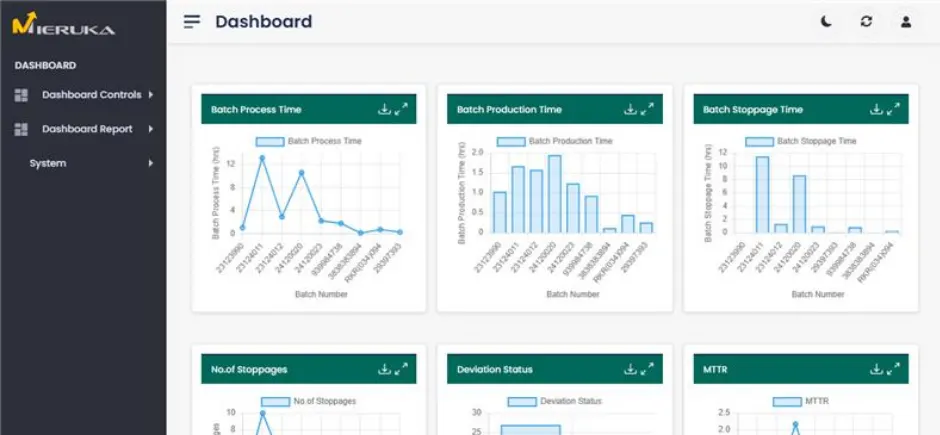
Visualization features we offer

Line Chart

Bar Chart

Pie Chart

